How can I visualize the data in the Portal?
In the Open Data Portal of the Cabildo de Tenerife you will find a multitude of data sets of different themes and characteristics. These data can be viewed from the portal itself or downloaded for consultation.
Visualizations are graphical representations of data that allow to communicate in a simple and effective way the information they contain. These visualizations help users to quickly understand a situation, identify trends and make informed decisions.
Depending on the data set we want to consult, it will provide us with different resources in formats that we can download and/or visualize from the portal itself.
Currently, the formats supported by the portal and directly viewable are JSON, GeoJSON, CSV, Esri Shapefile (SHP), TXT, RDF, PDF, PNG, JPEG, API, KML, RSS, SVG, XML and HTML. On the other hand, the formats that can only be downloaded are XLS/XLSX, GeoPackage(GPKG), KMZ, GPX, ODS, TSV or ZIP.
Let's see several of the data formats that we can find in the portal and how we can visualize them in each case:
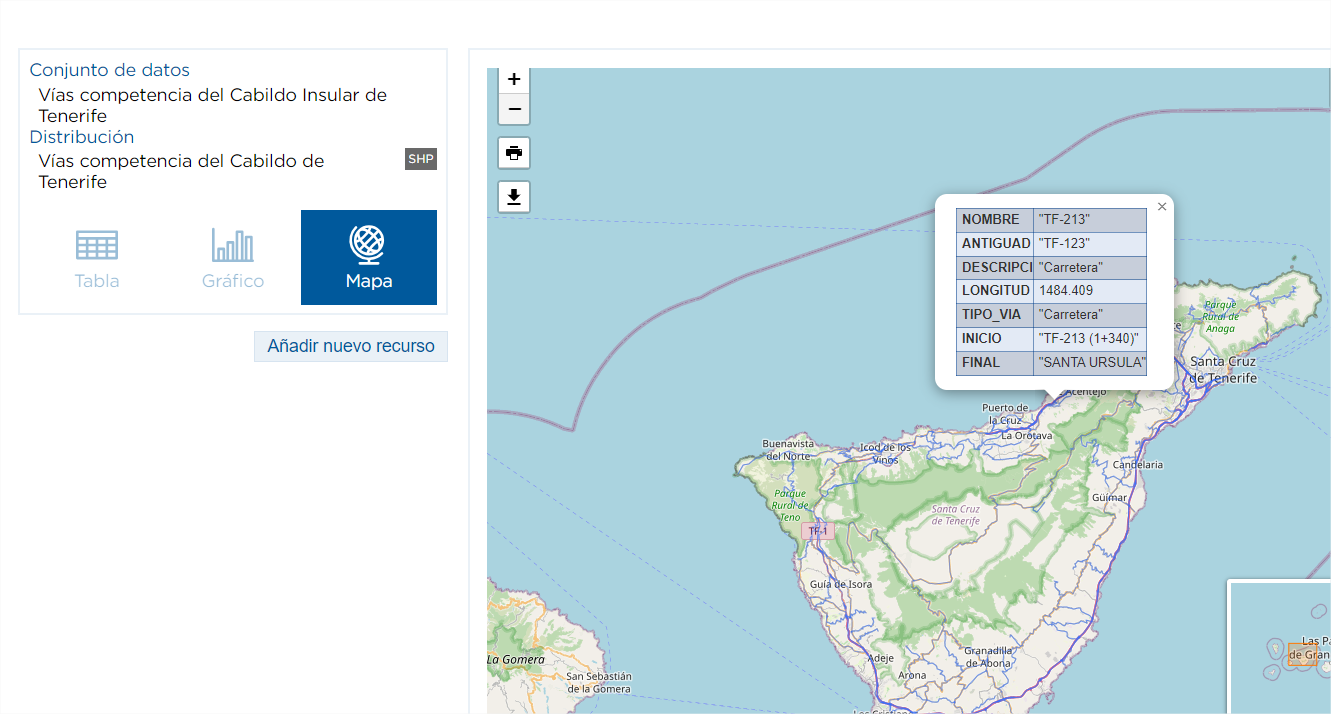
ESRI Shapefile (SHP)
The SHP format contains spatial data used for the exchange of geographic information between Geographic Information Systems.
This type of file allows us to obtain data visualizations on a map.
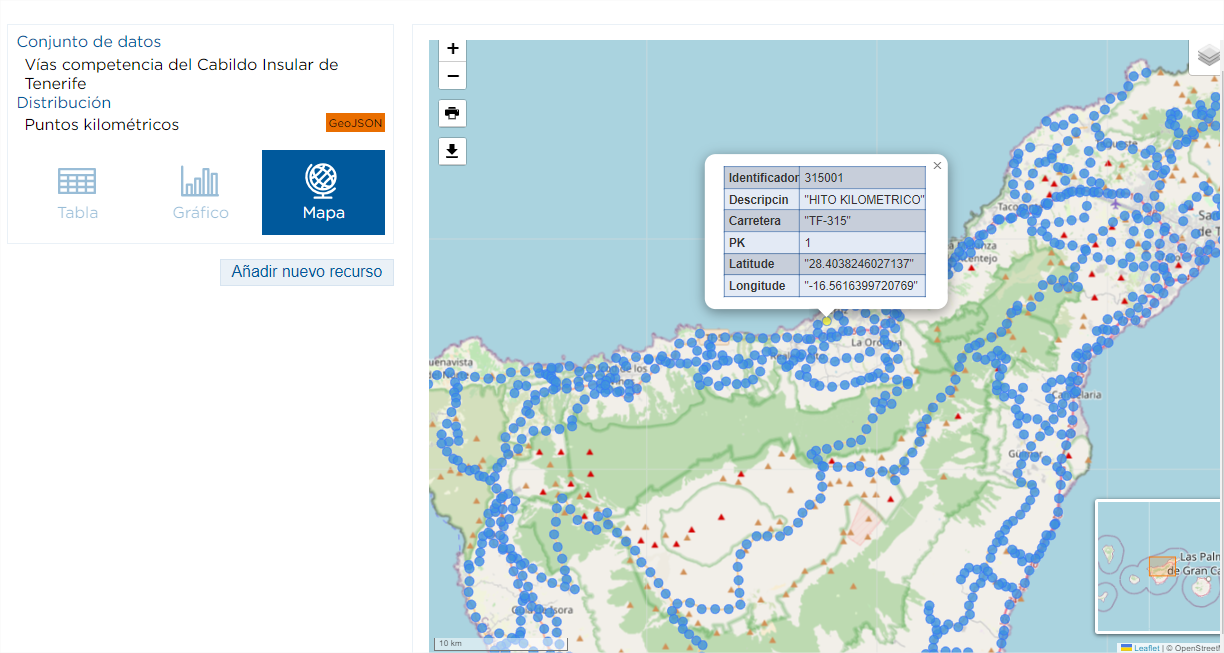
GeoJSON
The GeoJSON format is an open standard format designed to represent simple geographic elements, together with their non-spatial attributes.
As in the previous case, this format allows us to visualize the data on a map.
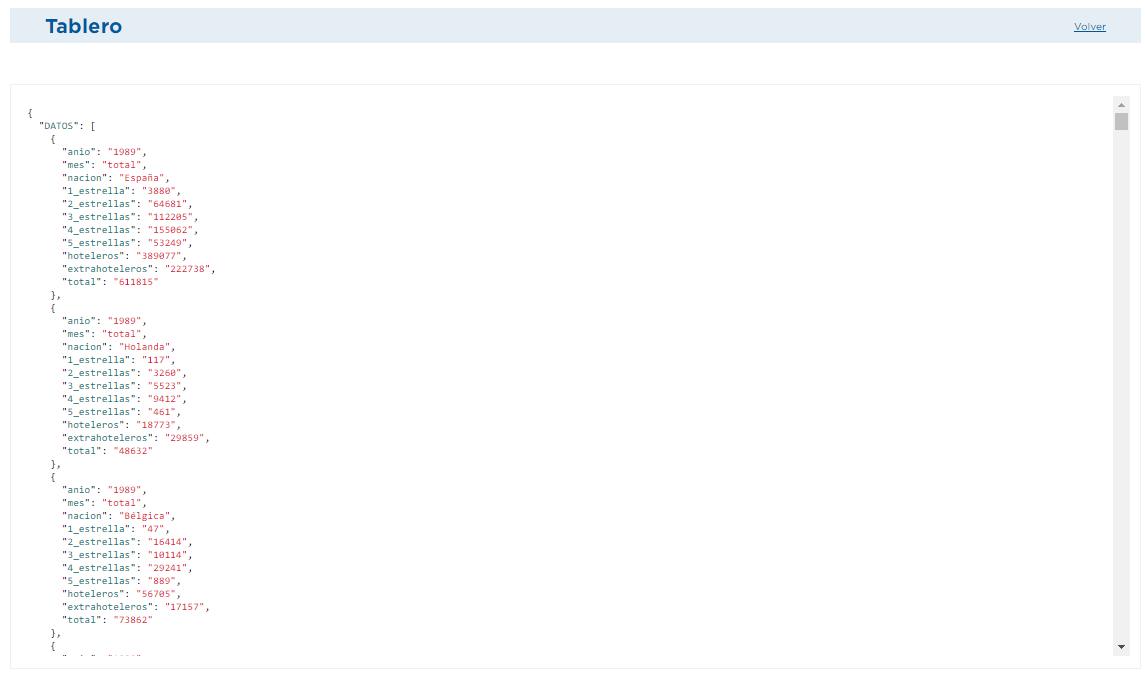
JSON
Acronym for JavaScript Object Notation, it is a simple text format for the exchange of data completely independent of the JavaScript language, but which uses conventions that are widely known, being constituted by an ordered list and collections of name/value pairs.
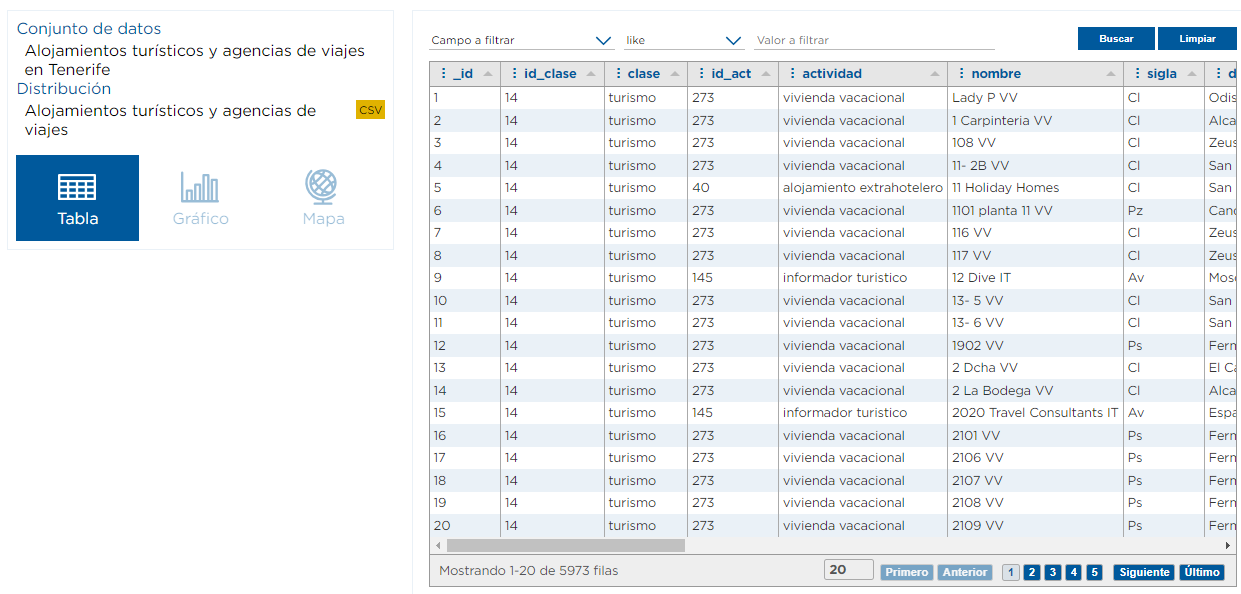
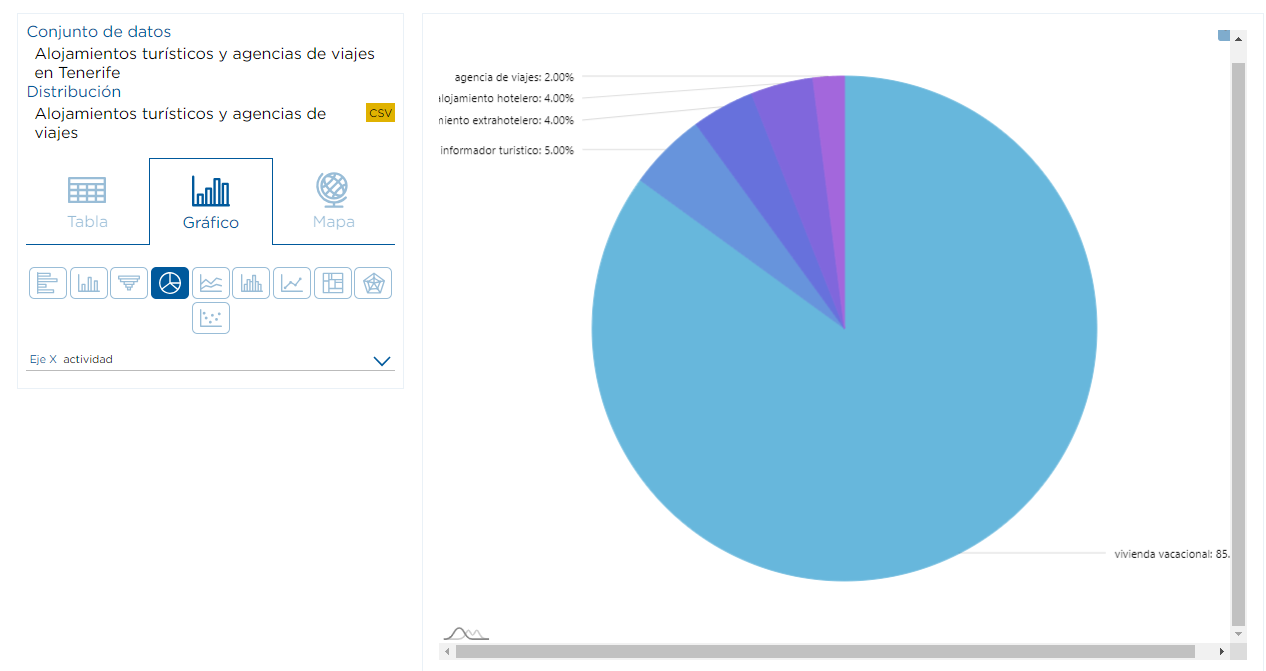
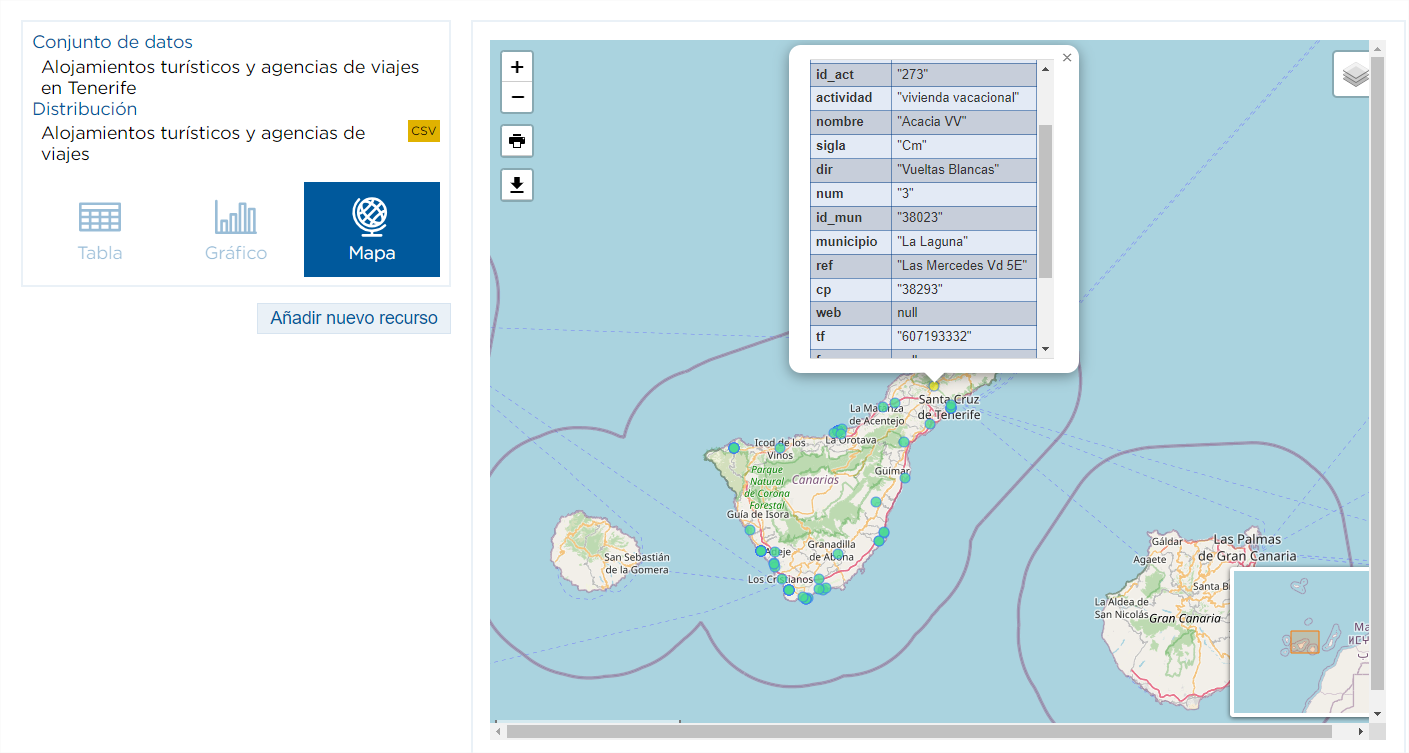
CSV
CSV files are documents in a simple open format for representing data in table form, in which columns are separated by commas and rows by line breaks.
The visualization of these files gives us many possibilities, as you can see in the following example, since we can visualize it as a table, graph or even on a map.