

Tabular data display
In the Open Data Portal of the Cabildo de Tenerife you can find several datasets in different formats. Today we will focus on how to work with tabular data visualization from the portal, which allows us to understand and analyze datasets more effectively, taking as an example the dataset "Tenerife Weather Stations".
Column selection
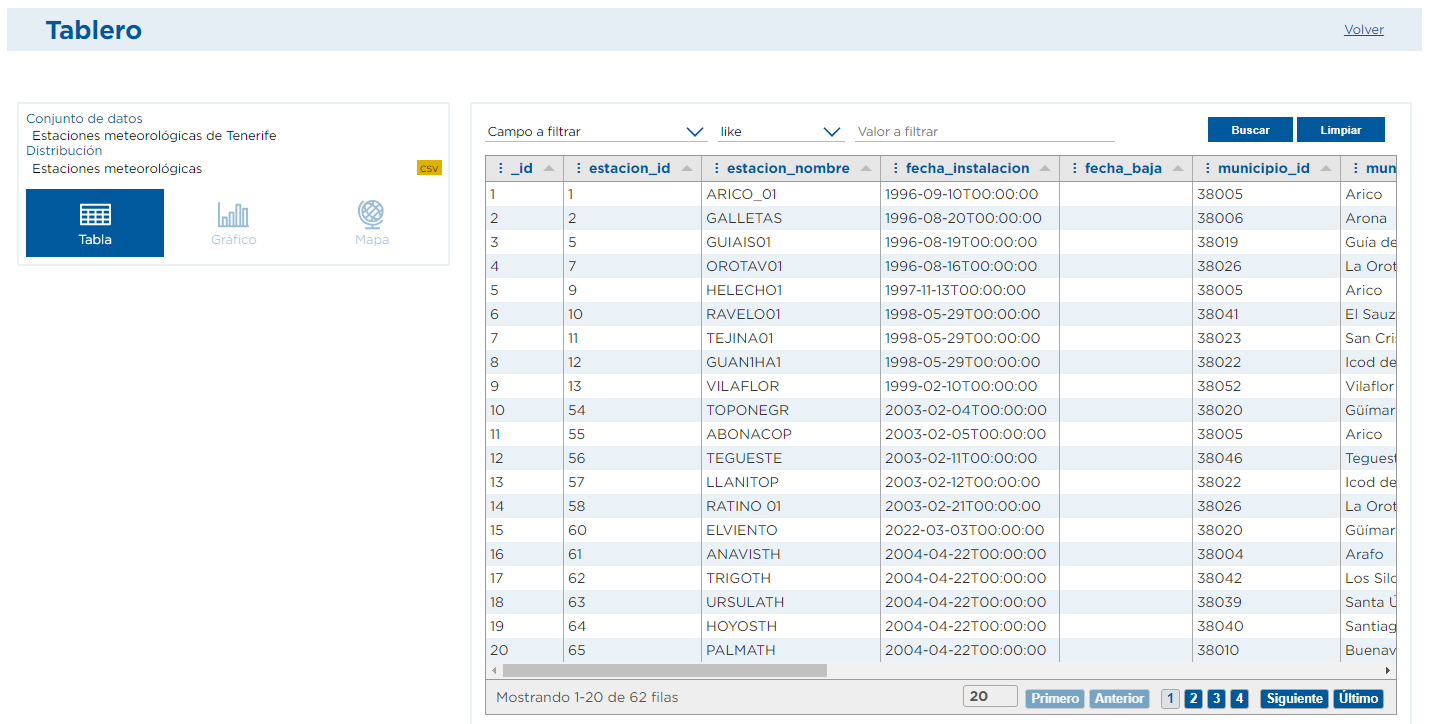
When we access the visualization of a dataset that is in a format that can be displayed as a table, such as a .csv file, we will be able to see a table that presents a large number of fields. However, it is possible that not all columns are relevant to our particular task. The Portal offers the possibility to customize the display of the data by selecting the columns we want to show. To do this, simply click on the three dots next to any of the column names, and a menu will pop up, allowing you to select the specific columns you are interested in from among all the existing ones. This is especially useful when we are looking to focus on specific information and want to avoid the visual clutter that can result from the presentation of unnecessary data.
This table display will always show an _id column that consecutively numbers each row of data, although it is not a column of the data set itself.
Sorting data
The ability to sort data is another feature of this portal visualization. Many times we need to sort the data according to a particular column, either alphabetically or numerically. The process is simple: just click on the name of the column you want to use as a sorting criterion. Automatically, the table is reorganized to present the data sorted by the values of the selected column in ascending order (and if you click again, in descending order). This feature is especially useful when we are looking for patterns or trends in the data that can only be detected through proper organization.
In addition, this type of visualization also allows the sorting of columns according to our needs. You simply click on the column you want to move and drag it to a new location. This makes it easier to visualize the data of interest.
Viewing rows
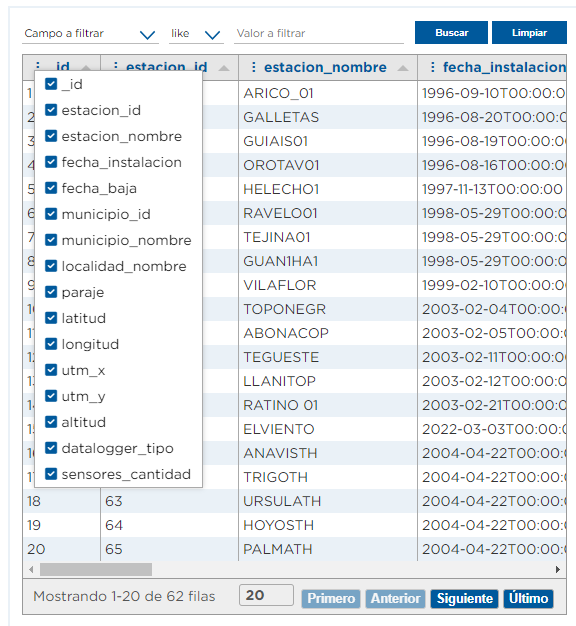
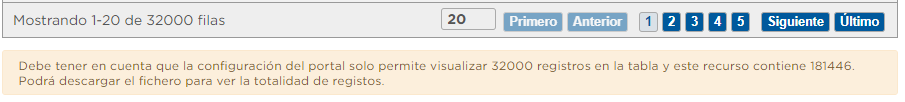
At the bottom of the table we can see at any time the number of rows in the data set. To avoid the possibility that displaying a large number of rows may make it difficult to manage the data, in the same place we can choose how many rows we want to display at a time, which can facilitate the assimilation of the information.
By default, when there are many rows of data to be displayed, they will be divided into several pages. It is from the bottom of the table where we can navigate between them to access all the available information, as well as identify which page we are on.
It should be noted that the display of data in table has a limitation of 32,000 records, so in data sets containing more records we can see a warning like this:
Data filtering
On many occasions, it is essential to filter the data to focus on a specific subset that is relevant to our needs. The tabular display incorporates filtering options that simplify this process; we only need to indicate the name of the field to filter by, the operator to use and the value to compare with.
The operators that can be used are like, equal(=), different (!=), greater than(>), less than(<), less than or equal(<=) and greater than or equal(>=). Depending on whether the column contains numeric data or text, it will make sense to use one operator or others. Let's look at two examples:
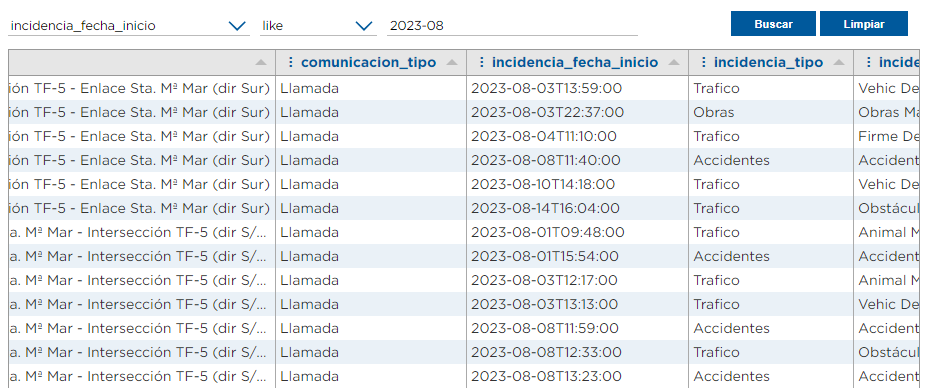
We are conducting a study on incidents on roads in Tenerife and we want to know how many occurred during the month of August. In the field to filter we are going to select the column incident_start_date, the operator like and, in the value to filter, we write 2023-08. With this filter we will get all the results for the month of August, without the need for an exact match.
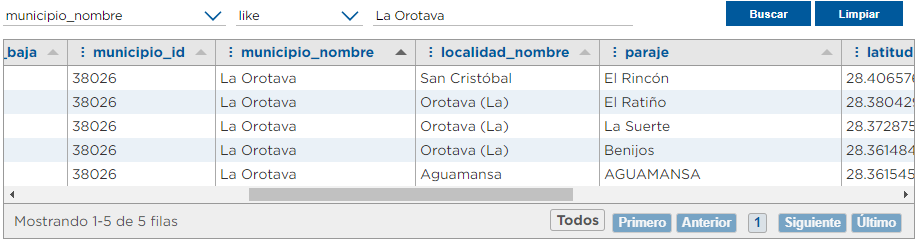
Now let's imagine that we want to identify the weather stations located in La Orotava. To do so, we will use the filtering options located at the top of the table. In this case, in the field to filter we will select the field "municipality_name", the operator = and in the Value to filter we will write "La Orotava". When applying the filter, the table is automatically adjusted to show only the rows that meet this criterion, where the municipality matches exactly "La Orotava".
Finally, if we want to remove any filters that may be active in the table, just click on the "Clear" button at the top right.
The visualization of tabular data through the Open Data Portal of the Cabildo de Tenerife is a powerful tool to understand and analyze relevant information. The ability to customize information by selecting specific columns, sorting data in a consistent way and filtering it based on specific criteria facilitates the use of the datasets and their reuse. By adopting a user-centered approach, providing intuitive tools, the portal facilitates the exploration and exploitation of information, thus contributing to understanding and informed decision making in a variety of contexts.