


Possibilities of the CSV format in the Cabildo's Open Data Portal
The CSV format is a simple way of storing data in tabular form, which allows for analysis and visualization. In the Open Data Portal of the Cabildo de Tenerife, CSV is one of the most used formats.
In this article we will delve into the nature of this format to get the most out of it, inside or outside the portal.
Characteristics and importance of the CSV format
CSV files (Comma-Separated Values) are simple open format documents that store and represent data in the form of a table, where each line of the file represents a row and the values of the columns are separated by a delimiter. The delimiter used in the CSVs of the Open Data Portal of the Cabildo de Tenerife is the comma character (,).
In the Open Data Portal of the Cabildo de Tenerife there are so far more than 150 datasets available, as can be seen in the Portal Dashboard.
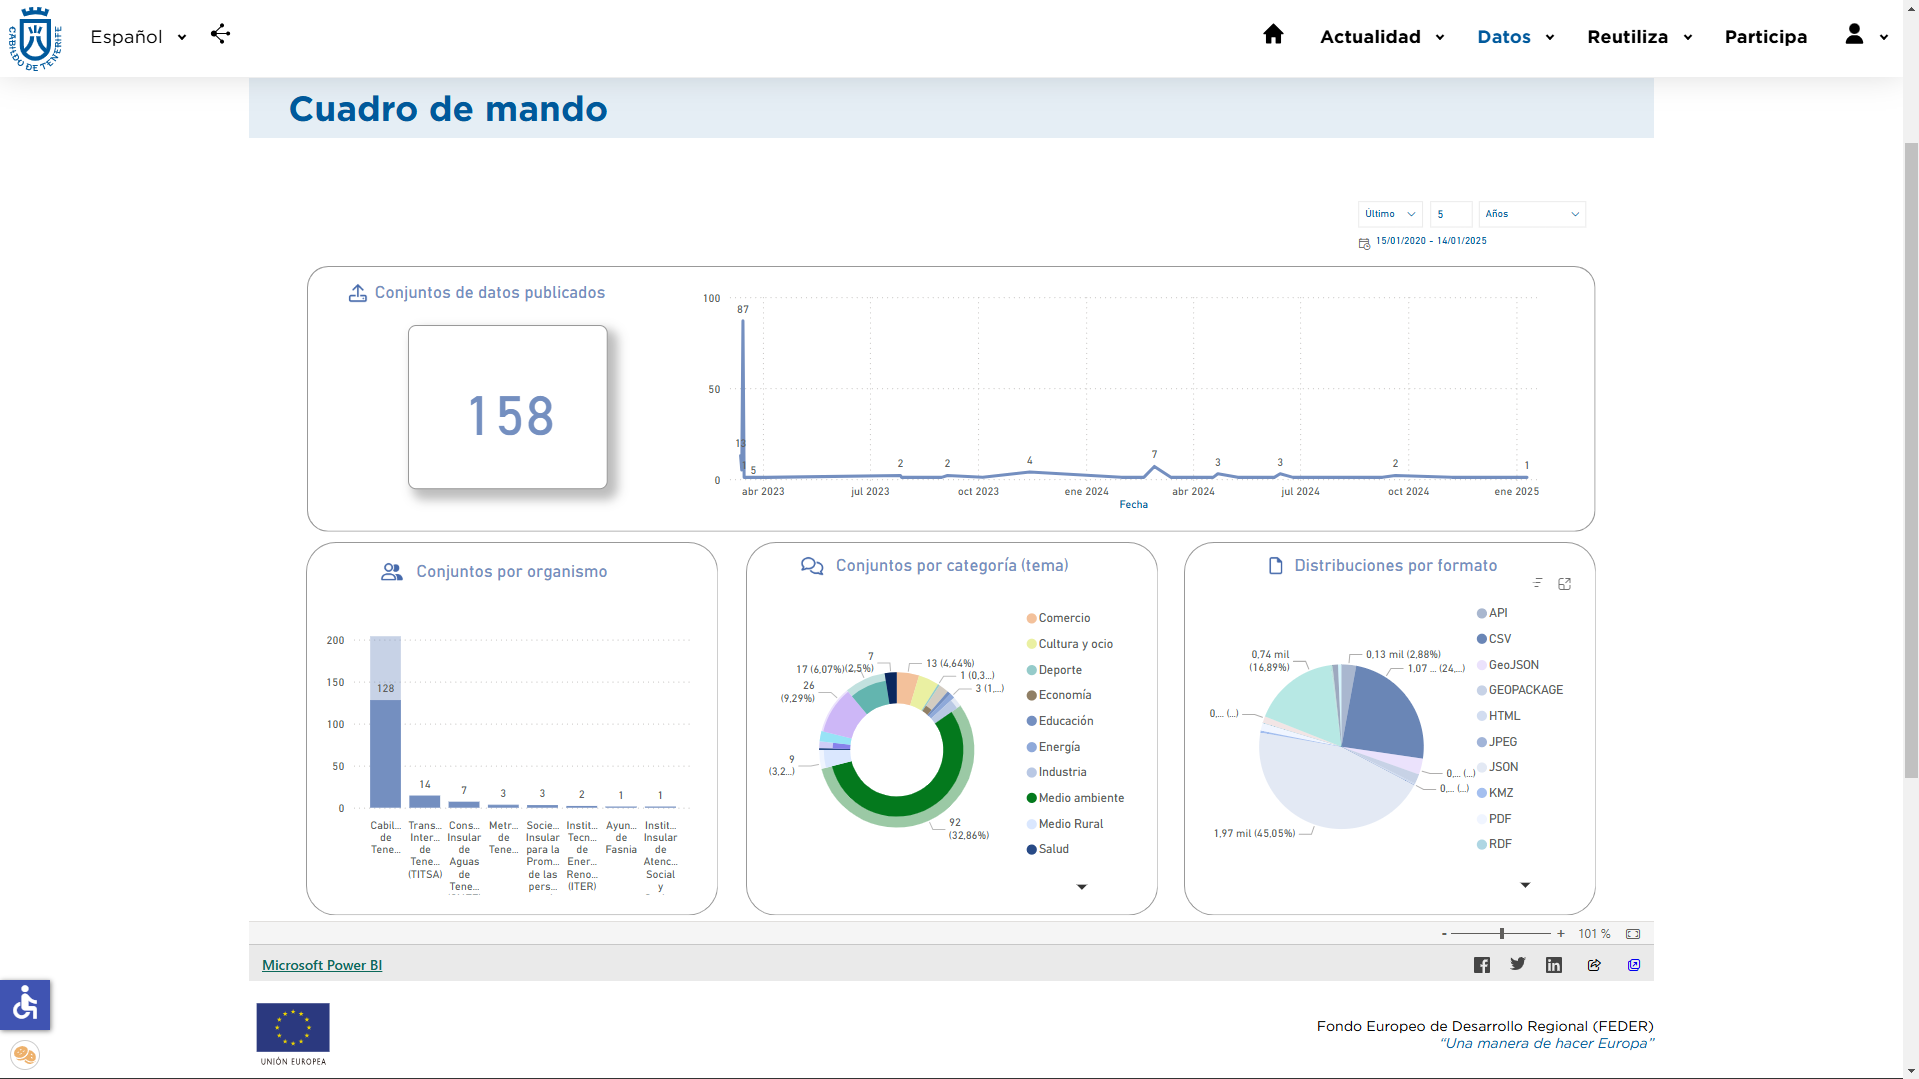
This is the second most numerous format in the portal, but, at a general level, its use is the most common in the publication of alphanumeric open data and in the transfer and exchange of information. In fact, CSV is the most common format both in the national catalog of datos.gob.es, which has more than 55,000 datasets available in this format, and in the European data portal (data.europa.eu), which has more than 300,000 datasets with at least one CSV.
The simplicity, its ease of interpretation by humans and machines or the fact that no specific software is required to open CSV files make it one of the most versatile and widely used formats for data exchange and storage in many fields.
General guidelines for CSV data
One limitation of this format is that it does not provide mechanisms to define the type of data in each column or to ensure that all values are correct. This can lead to errors such as missing values or mixing of data types, so it is important to apply good practices during data preparation, implement quality controls and associate the file with metadata schemas that define the data model.
Properly organized tabular data sets conform to a structure and form defined by some guidelines such as the following:
- Each file should contain only one data table.
- All records contain the same number of fields or columns (at least one).
- All values in the same column must be of the same data type (text, integer, decimal, date, etc.).
- Each variable is a column.
- Each record is a row, which is separated by line breaks.
- Each intersection of row and column corresponds to a cell.
- Each set of observations forms a table.
- Fields are separated by delimiter (",").
- Decimal numbers use (".") to separate the integer part from the decimal part.
The national data catalog .gob.es includes in its Practical Guide for the publication of tabular data in CSV files, complete information on this format, with the aim of promoting its proper use.
Visualizations offered by the CSV format
Although the CSV format itself is not specifically designed for visualization, there are several ways to visualize or present data in this format. The most basic form is in table form, but they can also be visualized as graphs using applications such as Microsoft Excel or LibreOffice; as maps; statistical analysis tools such as R or Python or dynamic visualizations in platforms that allow CSV files to be imported to create interactive visualizations (PowerBI, Tableau).
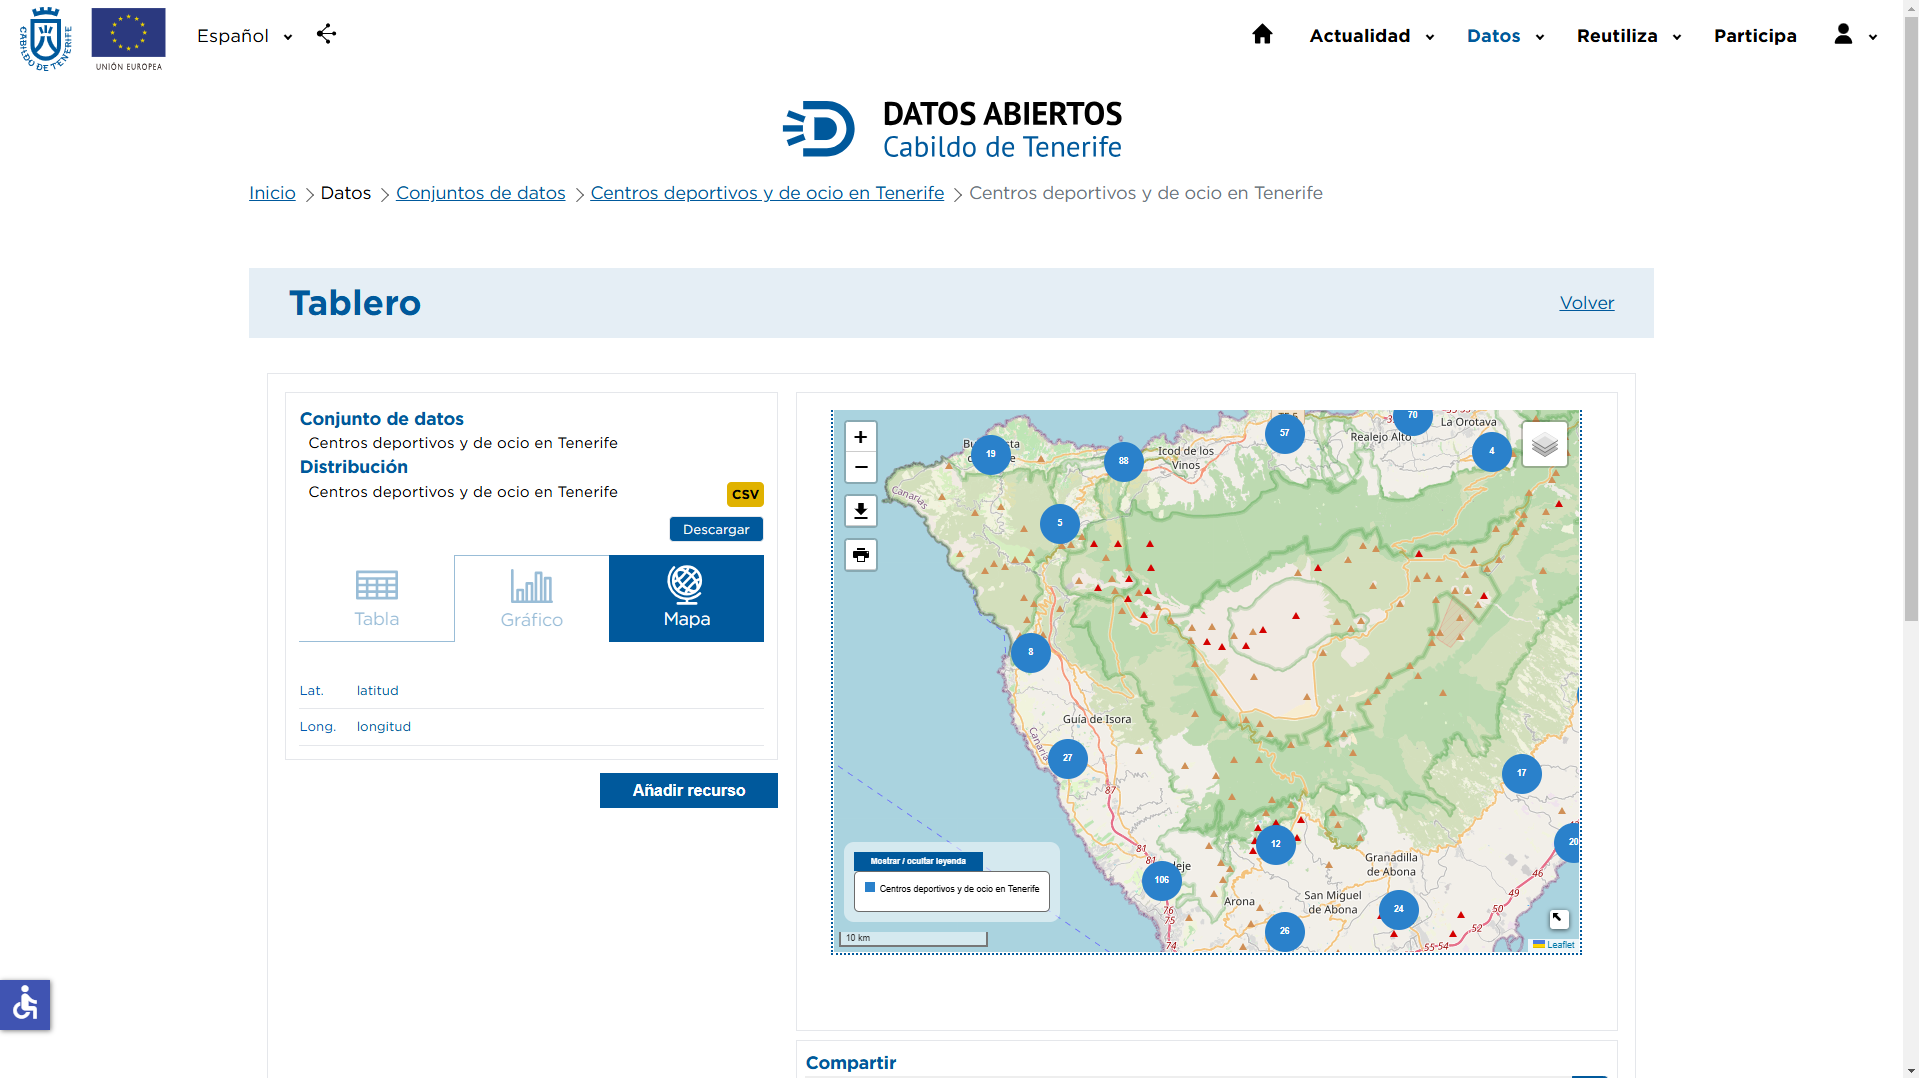
The Cabildo's open data portal not only allows the visualization of CSV files as a table(tabular data visualization), but also as a graph or a map. Resources containing latitude and longitude data can be displayed as a map, such as, for example, those of the set of Sports and Leisure Centers in Tenerife.
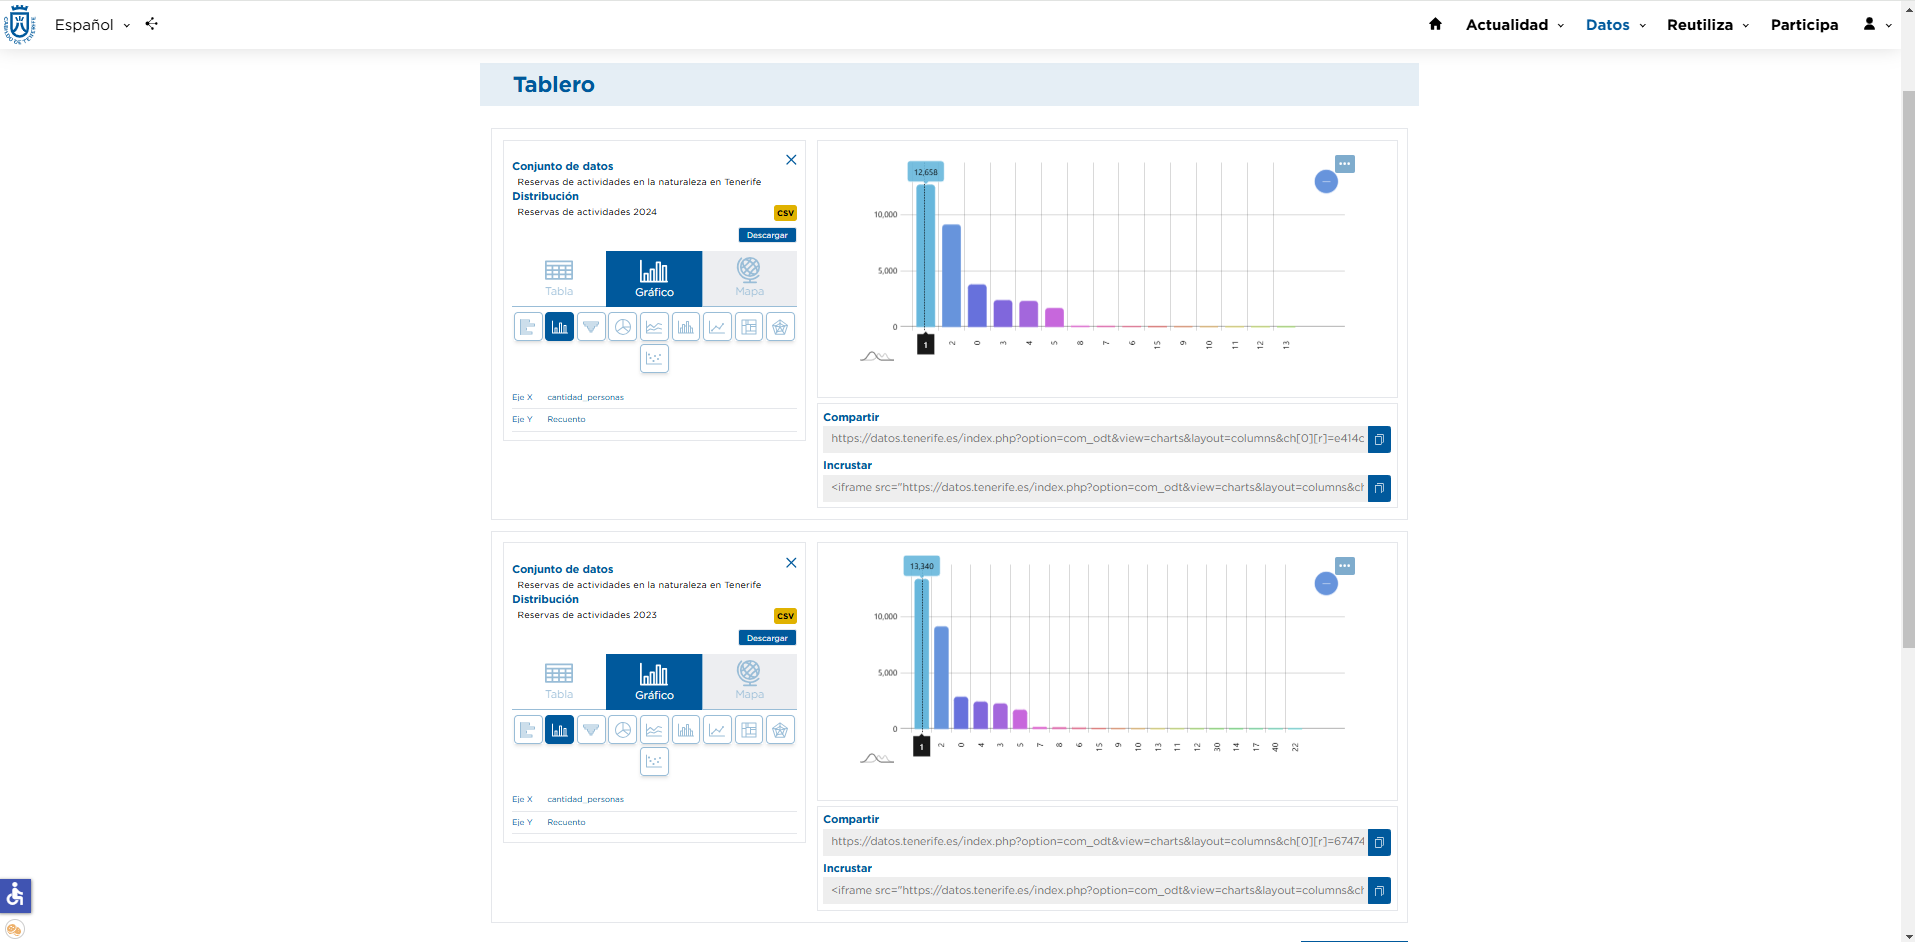
In addition, through the Dashboard option, in the Data block, it is possible to select CSV resources from the sets to visualize them, compare them and analyze their data, both as a table and as a graph. In this example, we compare the data of the set of Reserves of nature activities in Tenerife corresponding to different years.
You can find more information about the data formats that can be found in the portal and how they can be visualized in each case in the portal article: How can I visualize the data in the Portal?
Expand your knowledge about the portal of the Cabildo de Tenerife by consulting the training section.