

As we saw in previous posts with the visualization of tabular data, the Open Data Portal of the Cabildo de Tenerife allows you to visualize certain datasets in graph format, which helps you to understand the most relevant information.
-

Data visualization in graphs
Read more -

SPARQL point: what it is and how to use it
Read moreThe Cabildo de Tenerife's Open Data portal includes a SPARQL Point, which allows queries to search for sets containing a specific word or specific resources.
-

How to combine and interconnect resources in the Tenerife Open Data portal
Read moreThe visualization and study of the interconnections between data makes it possible to optimize the use of Open Data and is an essential element for the assimilation, understanding and analysis of data.
-
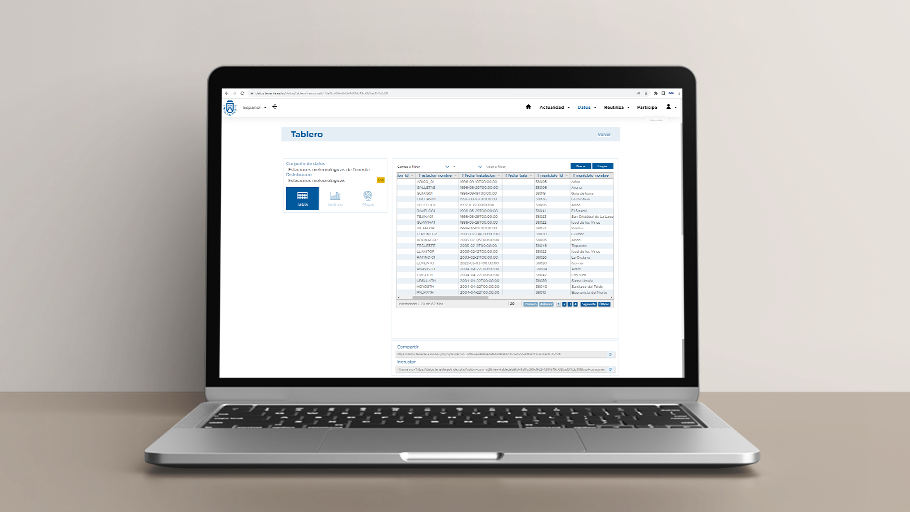
Tabular data display
Read moreIn the Open Data Portal of the Cabildo de Tenerife you can find several datasets in different formats. Today we will focus on how to work with tabular data visualization from the portal, which allows us to understand and analyze datasets more effectively, taking as an example the dataset "Tenerife Weather Stations".
-
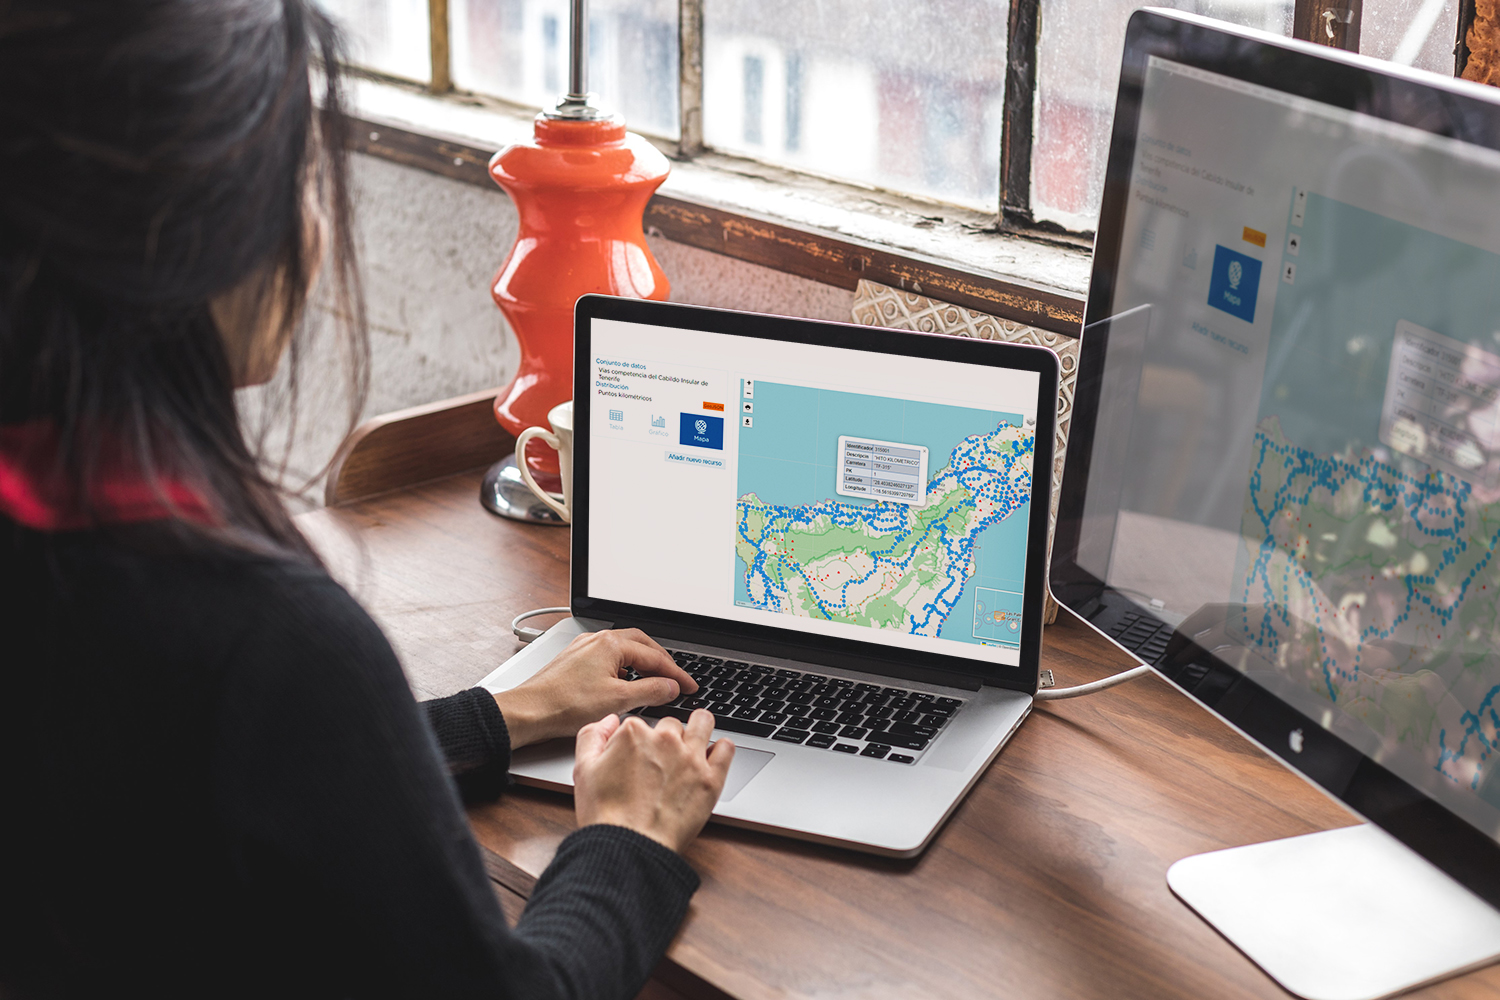
How can I visualize the data in the Portal?
Read moreIn the Open Data Portal of the Cabildo de Tenerife you will find a multitude of data sets of different themes and characteristics. These data can be viewed from the portal itself or downloaded for consultation.